Mensa Math

Apologies for links to political blogs. There’s some math here. The question is, what is the probability that one person could have survived two mass shootings (e.g., Gilroy and Las Vegas) ?

One fellow provides this calculation:

Las Vegas 2017 attendance: 20,000
Gilroy 2019 attendance: 80,000

I don’t know how many attendees were actually physically present at each event at the time of the shootings, but I’ll assume two thirds, so 14,520 and 52,800.

Proportion of US population present at LV shooting: 14,520 / 350,000,000 = .000041 or .0041%

Proportion of the population NOT at LV is the inverse or 99.9959%

Likelihood of one person being at both events is then: 1 – (.999959^52,800). Which is 88.8%. The number of times this apparently happened is 3, so it’s 0.888^3, or 70%.

In other words, through purely random chance it is more likely than not that 3 people who were at the LV 2017 shooting would also be present at the Gilroy shooting.

another fellow, who is a member of Mensa, provides this calculation:

The Gilroy Garlic Festival is a three-day event, so that 80,000 is reduced to 26,667 before being reduced another one-third as per Uncephalized’s assumption to account for the timing of the event. This brings us to an estimated 17,787 people present at the time of the shootings. Note that reducing the estimated 20,000 Las Vegas attendance by the same one-third gives us 13,340, not 14,520.
[…]
Gilroy probability: Dividing 17,787 by 350,000,000 results in a probability of 0.00005082, or one in 19,677.
Las Vegas probability: Dividing 13,340 by 350,000,000 results in a probability of 0.00003811428, or one in 26,237
Gilroy AND Las Vegas probability: Multiplying 0.00005082 by 0.00003811428 results in a probability of 0.0000000019369677096, or one in 516,270,868.

Someone posits in a comment to the second calculation, meekly, that perhaps the problem is analogous to the “birthday problem“. The Mensan responds:

No. That’s not relevant here because there is no equivalent to the finite number of birthdays in a year.

I’m personally not smart enough to be admitted to Mensa. However, it seems to me that the number of people in the United States is a finite number.

The Napkin Project by Evan Chen

This is what makes the Internet great:

I’ll be eating a quick lunch with some friends of mine who are still in high school. They’ll ask me what I’ve been up to the last few weeks, and I’ll tell them that I’ve been learning category theory. They’ll ask me what category theory is about. I tell them it’s about abstracting things by looking at just the structure-preserving morphisms between them, rather than the objects themselves. I’ll try to give them the standard example Gp, but then I’ll realize that they don’t know what a homomorphism is. So then I’ll start trying to explain what a homomorphism is, but then I’ll remember that they haven’t learned what a group is. So then I’ll start trying to explain what a group is, but by the time I finish writing the group axioms on my napkin, they’ve already forgotten why I was talking about groups in the first place. And then it’s 1PM, people need to go places, and I can’t help but think:

Man, if I had forty hours instead of forty minutes, I bet I could actually have explained this all.

This book is my attempt at those forty hours.

This project has evolved to more than just forty hours.

The most current draft is also available as a PDF.

Bitcoin, explained

This video is a bit long (under 30minutes), but it is a superb explanation of the principles of Bitcoin. I did not really know what a blockchain was or how mining really worked until I watched it, and I unequivocally recommend watching this for anyone with even the slightest curiosity about cryptocurrency – which soon, will be everyone.

forget Obamacare and SCOTUS: it’s Tau day! it’s Back to the Future Day!

So, apparently there was this big hoo-hah today about some political thing or the other. But the real significance of today is this:

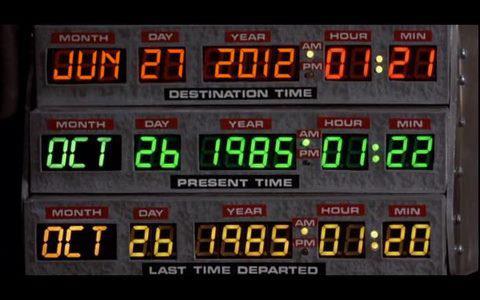
Back to the Future.. but the Future is NOW!

That’s right – today is the day that Doc set as the Future in the first Back to the Future movie!

UPDATE: No, it wasn’t. Three years too early. Sigh.

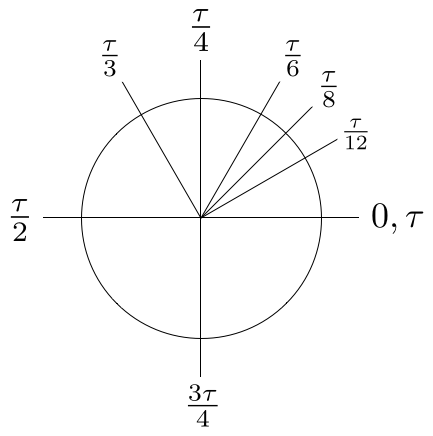
What’s more, today is also June 28, or “6/28” – which means it is Tau Day! What is tau, you ask? It’s the true circle constant (6.28), unlike that upstart Pi. For more details on the primacy of Tau and the centuries-old conspiracy that is Pi, see the Tau Manifesto, though really I think this image says it all:

Tau is one turn

and here’s a snappy little music video too:

so, enjoy today, a most historic and important day! And don’t worry/gloat too much about that other thing. It’s really not as important as this.

Martin Gardner, 1914 – 2010

A legend has passed away last week: Martin Gardner, arguably the inventor of the term “recreational mathematics” and columnist for Scientific American for almost 30 years.

Here are tributes to Gardner at Discover Magazine, Scientific American, and also some thoughts by Richard Dawkins. I find it interesting that Gardner is remembered for his skepticism; I wonder how many people praising him for it are also true believers in the Singularity? (a concept ever deserving of Gardner’s critique, if there ever was one. My skepticism on Singularity is a matter of record).

Pi Day is March 14th (3/14)

I am geeked out by this – finally, formal recognition for the number pi!

An irrational number that has been calculated to more than 1 trillion digits, pi is a concept not totally foreign to today’s Washington. But in this case, the goal was to promote efforts by the National Science Foundation to improve math education in the United States, especially in the critical fourth to eighth grades.

Rounded off, pi equates to 3.14, hence the designation of March 14 as Pi Day under the resolution. Informal celebrations have been held around the country for at least 20 years, but Thursday’s 391-10 vote is the first time Congress has joined the party.

So who exactly were the ten who voted against? What are they, non-Euclideans or something?

Incidentally, one of my close friends from grad school is actually getting married today. Congratulations, Dustin and Gwen!

election math

I just finished extolling the virtues of keeping politics out of the Otakusphere, but this isn’t really a post about politics, it’s about math. Besides, only a geetaku audience can appreciate this.

Good Math Bad Math points out the innumeracy of many election-beat reporters who seem to be unaware of how percentages work:

as results were coming in from Ohio, one reporter was saying “Black turnout in Cleveland was only around 18%, which is only up 2% from four years ago”. That’s a rather classic bad-math error. A two percent increase over 16% is 16.32% – which is a trivial change. A change from 16% to 18% is actually a 12.5% increase – which is very significant.

At the opposite side of the scale, I think it’s astounding just how eerily accurate Nate Silver of fivethirtyeight.com was regarding his predictions. The cool thing about his methodology is that he actually simulates the election results in Monte Carlo fashion, running each one 10,000 times:

The basic process for computing our Presidential projections consists of six steps:

1. Polling Average: Aggregate polling data, and weight it according to our reliability scores.

2. Trend Adjustment: Adjust the polling data for current trends.

3. Regression: Analyze demographic data in each state by means of regression analysis.

4. Snapshot: Combine the polling data with the regression analysis to produce an electoral snapshot. This is our estimate of what would happen if the election were held today.

5. Projection: Translate the snapshot into a projection of what will happen in November, by allocating out undecided voters and applying a discount to current polling leads based on historical trends.

6. Simulation: Simulate our results 10,000 times based on the results of the projection to account for the uncertainty in our estimates. The end result is a robust probabilistic assessment of what will happen in each state as well as in the nation as a whole.

This is a more stochastic approach to election prediction which I think matches reality very well.

I also found this collection of links, which are dangerously interesting. Among them, “The Mathematics of Voting“:

Mathematical economist Kenneth Arrow proved (in 1952) that there is no consistent method of making a fair choice among three or more candidates. Topics cover Fairness Criteria, Voting Methods, Fairness Criteria applied to Voting Methods, and Ranking Procedures.

Then there’s the old favorite topics, like should we ditch the Electoral College? (no). Should we use an Instant Runoff Voting system instead? (no).

Election math is cool.